

Background
I was recently part of a migration from AWS (Amazon Aurora - MySQL-Compatible) to Azure (Azure database for MariaDB 10.3) for a large suite of applications. This platform contains a number of Drupal 8 sites, which surface content through JSONAPI (now part of core in Drupal 8).
The issue
Drupal is extremely flexible, and creates a highly normalised table structure, 2 tables per field on a piece of content (1 for revisions, and another for active data). A given piece of content can contain dozens of fields. When loading a piece of content, it is not uncommon in Drupal to have 20+ joins on a single SQL query.
These SQL queries the end developers do not write by hand, Drupal abstracts this detail away through the entity API.
We were seeing SQL queries appear to never complete when they had lots of JOINs in them. One query I found that was 'stuck' had 53 joins. In saying that, the database overall data size was tiny, with only 228 pieces of content in Drupal (this is very low, some Drupal sites can have millions of items of content).
Running a SHOW FULL PROCESSLIST showed these queries were all stuck in a Statistics phase.
The issue seemed to disproportionately impact SQL queries with > 40 joins in a single query.
These queries did not appear to ever complete, and the CPU was pegged at 100%.
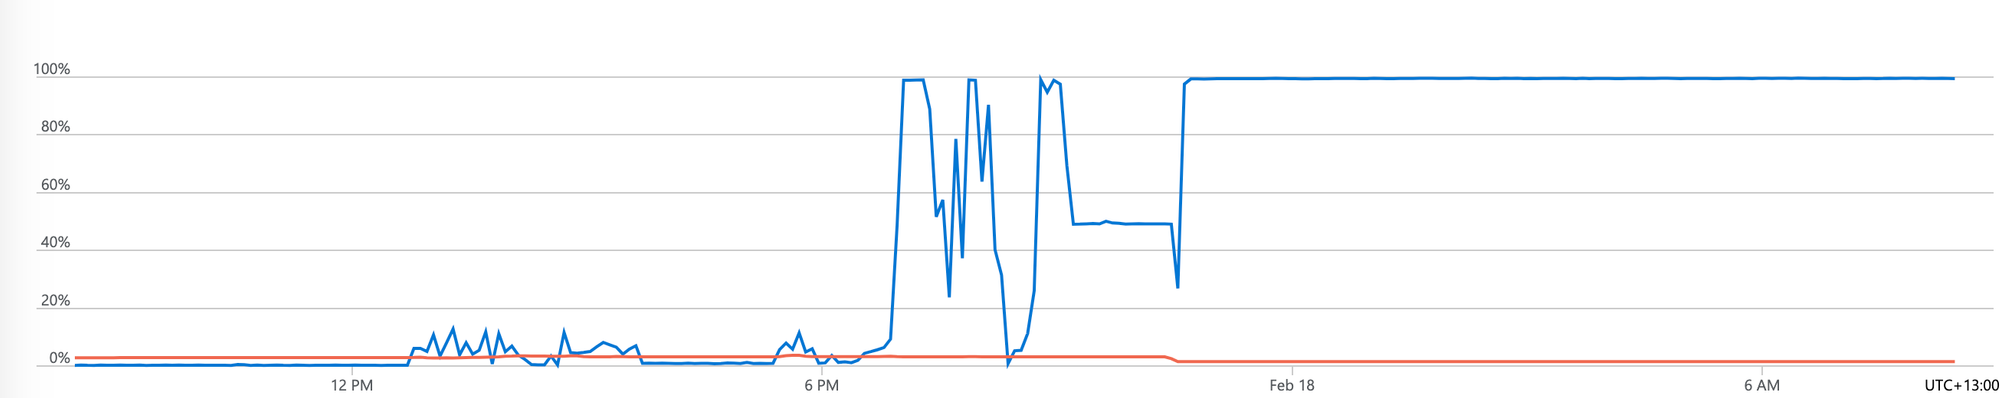
Upsizing the vCPU count in the database cluster had no impact, as the 'stuck' queries just consume all the CPU available. We even had trouble trying to connect to the database cluster via the MySQL client, due to timeouts.
Research
After seeing the seeing queries stuck in Statistics phase, we did some digging to see what other content had to say on this topic:
- https://dev.mysql.com/doc/refman/8.0/en/general-thread-states.html seemed to indicate that
Statisticsphase hanging could be due to a lack of IOPS - https://stackoverflow.com/questions/17797191/sql-query-stuck-in-statistics-state gave the first clue about
optimizer_search_depthand how this can blow out query times - https://www.drupal.org/project/ubercart/issues/636574 indicated that tuning
optimizer_search_depthto a value lower than62would be a good idea. - https://mariadb.com/resources/blog/setting-optimizer-search-depth-in-mysql/ contains really useful information on tuning
optimizer_search_depthin general - https://lists.mysql.com/internals/37635 has the background on why
62was chosen as the default foroptimizer_search_depth
Actions we did
After reading the above literature, we ended up settling on the 'automatic' tuning for optimizer_search_depth.
optimizer_search_depth = 0This will mean that queries that do > 7 JOINS may not run the best query path, but at least they will actually complete. This is a win in my books.
I also killed every running query manually that was stuck in the Statistics phase. This brought down the CPU. The CPU never went up to the same levels due to the change in optimizer_search_depth.
Result and final thoughts
The 53 JOIN query that used to fail to complete, now completes in 268ms. Not fast, but a damn sight faster than several days.
I still don't have a good explanation as to why the 53 join query had no issues executing on AWS Aurora MySQL, optimizer_search_depth is set to the default of 62 on there. I assume (like most of Aurora) that there is some special AWS sauce helping here. If anyone can shed more information on this, please let me know in the comments.